[en] Presenter Adaptive enhancements
[en] You can now build reports with real data from data sources. Learn more: プレゼンター・アダプティブレポートの作成.
 |
[en] We've also improved the overall report-building experience with these added enhancements:
[en] Auto-aggregation on some visualizations and on numeric columns in tables.
[en] A color picker that saves recently-used colors.
[en] Pick lists now behave more like pick lists in Presenter Structured.
[en] For charts and visualizations, column selection is now saved even when you change the chart type and you can now customize value labels on charts. We've also added a new chart type of KPI visualization.
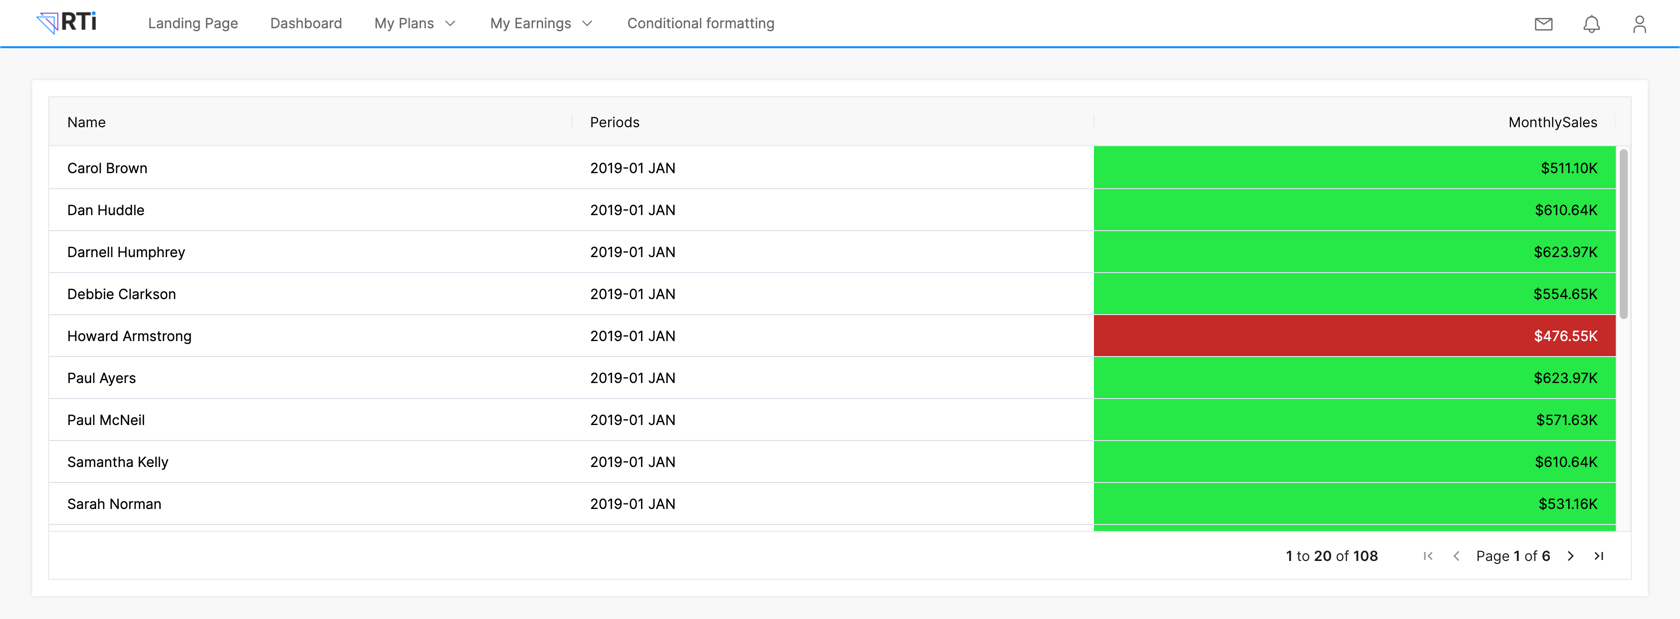
[en] For data tables, you can now set conditional formatting and define column widths so your tables display exactly as you want them to. Learn more: [プレゼンター・アダプティブ]テーブルへの条件付き書式の追加.
 |