We're continuing to enhance our newest reporting solution, Presenter Adaptive
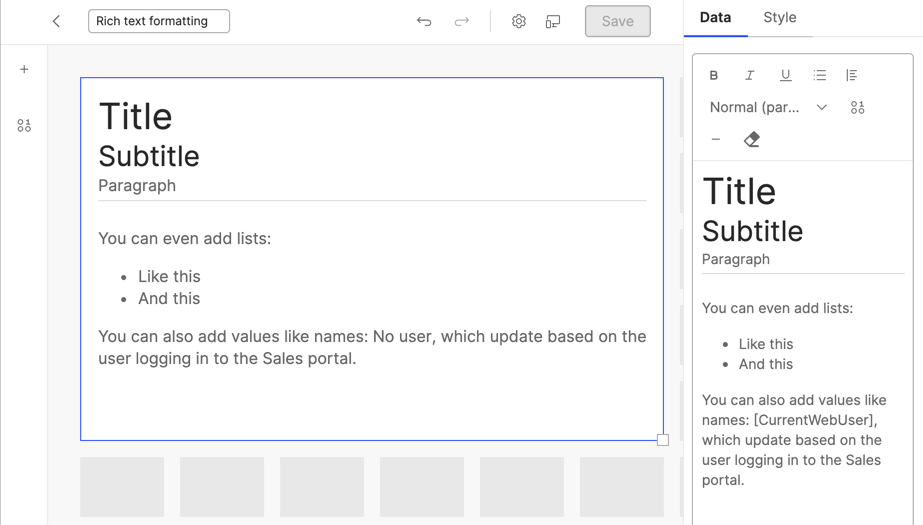
Presenter Adaptive now uses a rich text editor when adding text values to reports, giving you much more flexibility in adding content to your reports.
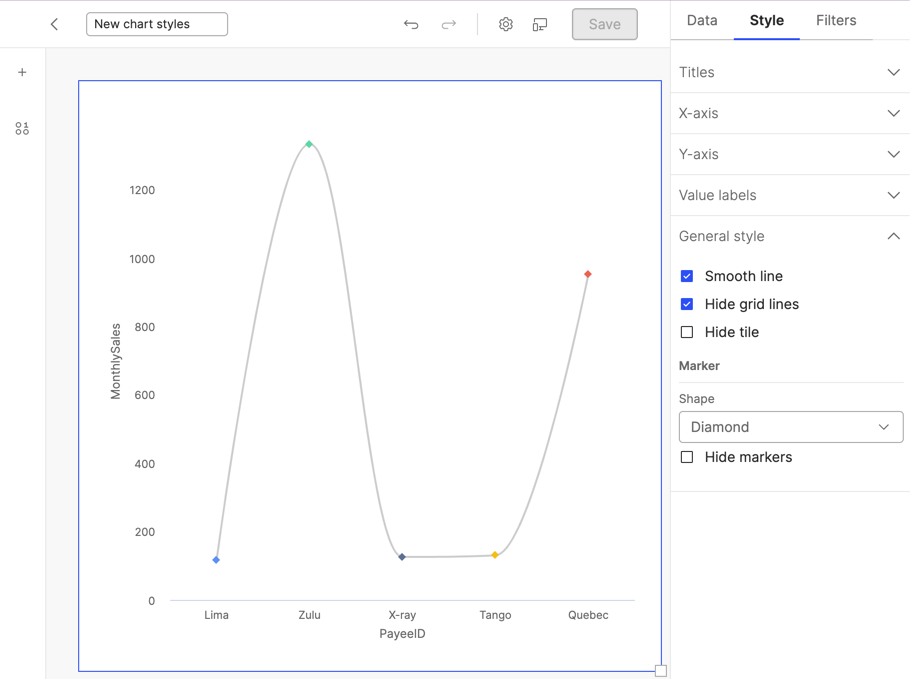
We've made significant improvements to chart styling for Presenter Adaptive in this release. We've organized style options into collapsible panels, making it easier to find what you need and easier to work with the specific areas you want to style.
For all charts, we've added options like the ability to hide the grid lines that normally appear in the background of charts. You can also now set minimum and maximum values on the y-axis. We've also added more options for some types of charts. For line and scatter charts, you can now set the line style to smooth. You can also now change the shape that marks each of the points on the chart.
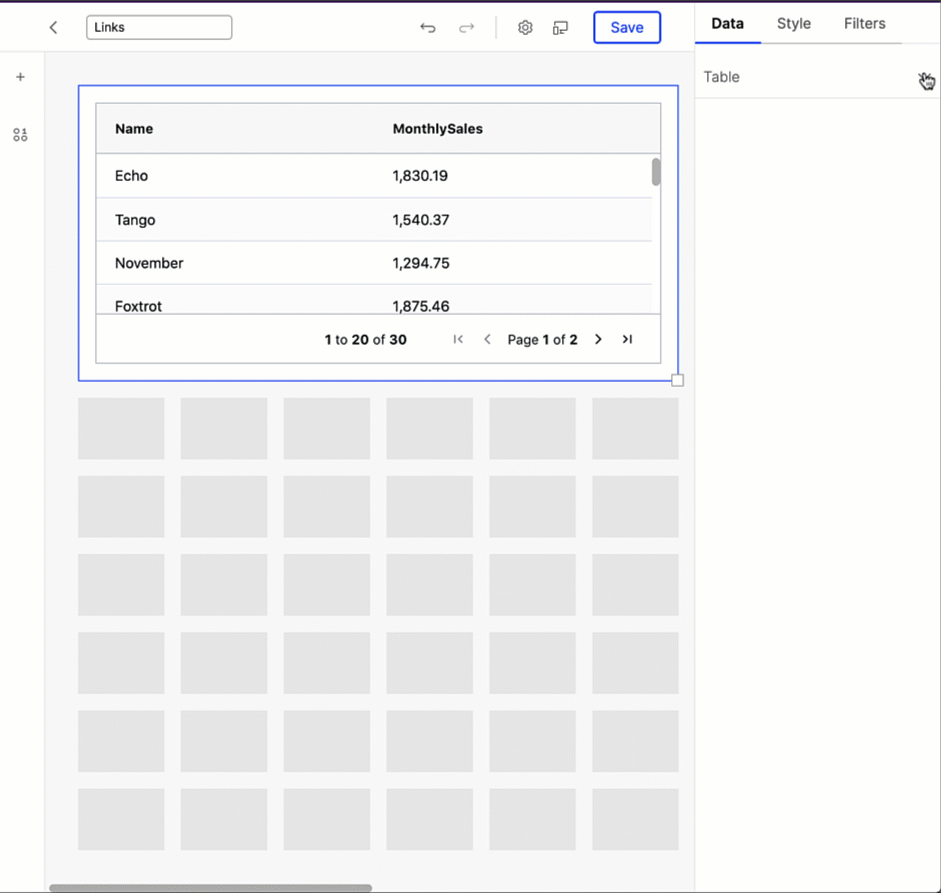
We've also updated the look of tables and added link support for tables. For information on how to set up links, read: Adding tables to a Presenter Adaptive report.