Data Sources
In Varicent ICM, data sources are any calculation, table, or data store that can be used to create another data source or to display results in reports and web forms.
Adding a Data Source
In Varicent ICM, you must add a data source when creating View tables and pick list fields.
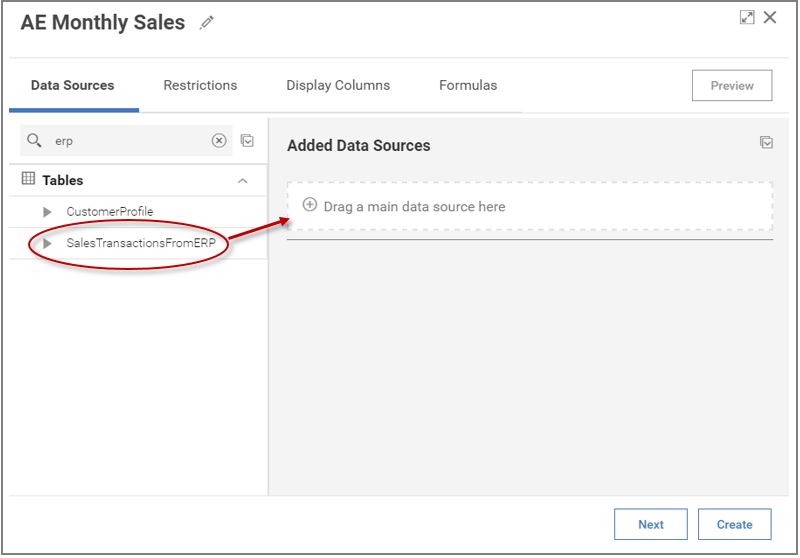
From the Data module, create an object that requires a data source.
On the Data Sources tab, drag your main data source and place it in the Added Data Sources field.
Adding Data From Multiple Sources
In Varicent ICM, data from multiple sources can be combined by adding columns or adding rows.
For example, one table might contain all of the sales data that is required to calculate total sales, and another might contain quotas and compensation rates that must be applied. Multiple sources are required for this calculation.
The model administrator can add multiple additional sources to the current source.
Add Sources by Columns
In Varicent ICM, you can join two or more tables or calculations together to define the data sources for your calculation by adding columns. This is referred to as a join.
Joining data sources by adding columns is typically used when the data from two or more sources will be compared against each other, or used in a formula.
Normally, you join data sources together based on a point of commonality by defining restrictions for the join. By default, columns with the same name and of the same type are joined automatically. You can choose to disable the automatic creation of joins.
For example, consider a situation where you join a product table to a payee table to display the products that were sold by each payee. If you restrict, or join, your results based on the payee ID, you can get the results shown in the following tables.
PayeeID | Name |
|---|---|
001 | John Smith |
002 | Sue Jacobs |
003 | Marc Frederick |
004 | Mary Scott |
ProductID | ProductName | PayeeID |
|---|---|---|
123 | Printer | 001 |
234 | Cable | 001 |
345 | Monitor | 003 |
PayeeID | Name | ProductID | ProductName |
|---|---|---|---|
001 | John Smith | 123 | Printer |
001 | John Smith | 234 | Cable |
003 | Marc Frederick | 345 | Monitor |
Important
No data is displayed for Sue Jacob (002) or Mary Scott (004) because there are no corresponding rows in the Product table for those payees.
You can use restrictions to join each new source to an existing source based on a point of commonality. For example, if the initial source contains transactional data for each payee, and the second source contains compensation rates to be applied to sales, you must specify how to associate the two types of payee data. If the compensation rates vary based on job title, and Title ID is contained in both tables, they can be joined on that basis, for example, ERP.TitleID = Rates.TitleID.
Adding restrictions is an important part of adding a data source. If you do not create restrictions, each row in the new source is added to each row in the existing source. This action creates many more rows than either source would have individually.
For example, if the first source had 100 rows and the second had 50 rows, the result of a join with no matches would be 100 x 50 = 5000 rows, or a row for each possible combination of rows in the two sources.
While restrictions are normally necessary, there might occasionally be instances where you want to display all the possible row combinations when you join two sources. Imagine that you have a product table and a payee table, and you want a table that shows each product that might potentially be sold by each payee.
PayeeID | Name |
|---|---|
001 | John Smith |
002 | Sue Jacob |
003 | Marc Frederick |
004 | Mary Scott |
ProductID | ProductName | PayeeID |
|---|---|---|
123 | Printer | 001 |
234 | Cable | 001 |
345 | Monitor | 003 |
Imagine that you complete the following steps:
Define the payee table as your first source.
Add columns to the payee table from the product table.
Decline to add restrictions.
Your join produces the results in the following table.
PayeeID | Name | ProductID | ProductName |
|---|---|---|---|
001 | John Smith | 123 | Printer |
001 | John Smith | 234 | Cable |
001 | John Smith | 345 | Monitor |
002 | Sue Jacob | 123 | Printer |
002 | Sue Jacob | 234 | Cable |
002 | Sue Jacob | 345 | Monitor |
003 | Marc Frederick | 123 | Printer |
003 | Marc Frederick | 234 | Cable |
003 | Marc Frederick | 345 | Monitor |
004 | Mary Scott | 123 | Printer |
004 | Mary Scott | 234 | Cable |
004 | Mary Scott | 345 | Monitor |
Important
This example represents an unrestricted join, where every row on the first table is matched to every row on the second table. It is important to carefully define joins to make sure that your information is returned as intended.
Adding Additional Sources by Columns
In Varicent ICM, you can join two or more data sources together by columns to compare the data sources or use the data in a formula.
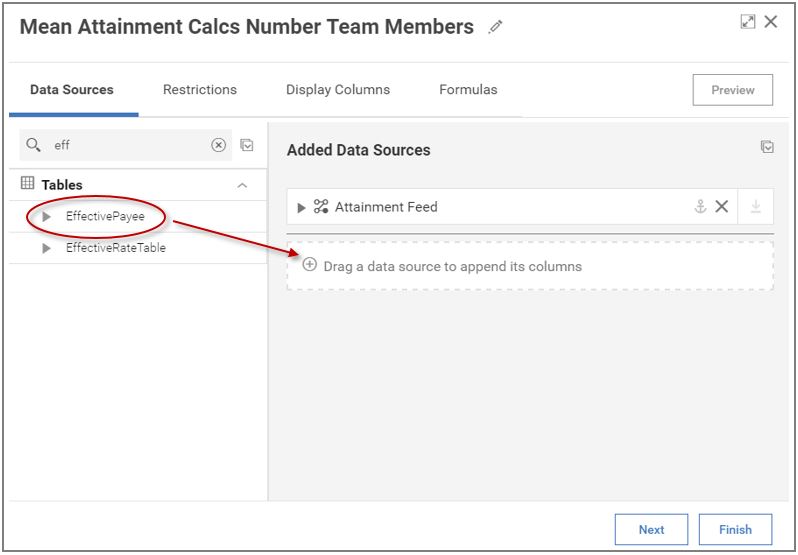
On the Data Sources tab, drag the first source and place it in the Added Data Sources pane.
Drag the second source and place it in the field below the first source.
To add additional sources, drag the source that you want to add and place it above or below a source in the Added Data Sources pane.
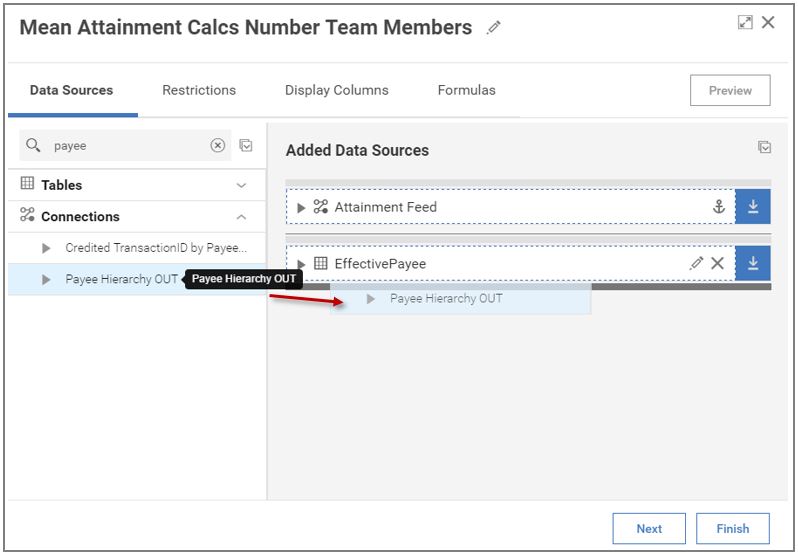
Define restrictions for the join.
Add Sources by Rows
In Varicent ICM, you can create a union between data sources by adding data from one source to the bottom of another source. This creates one data source.
You might find that joining sources (adding columns) does not organize your data in a way that creates the results that you want. If so, you can append sources by adding rows. This feature is similar to adding columns in that both options are used to relate information from multiple sources.
Consider a plan that pays compensation to employees based on their total sales minus any returns that are made by month. Look at the information for employee 001.
Employee | Total Sales | Date |
|---|---|---|
001 | 1500 | Month 1 |
001 | 250 | Month 1 |
001 | 700 | Month 2 |
001 | 500 | Month 3 |
Employee | Returns | Date |
|---|---|---|
001 | -100 | Month 1 |
001 | -50 | Month 2 |
If you follow these steps to add rows from the return data table to the sales data table, the results match the Results of adding rows table.
Add rows from the return data table to the sales data table.
Look for a sum of the total sales.
Partition the results by months.
Total Sales | Months |
|---|---|
1650 | Month 1 |
650 | Month 2 |
500 | Month 3 |
A result is shown for Month 3, even though there is no record for that month in the return data table. If you link these tables by adding columns, the row containing March would not be displayed.
All columns in the source table must be mapped to a column in the union table. For this reason, the columns in the source table must be similar to the columns in the union table. For example, both the Sales data table and the Return data table had employee ID, amount, and date columns.
Adding Additional Data Sources by Rows
In Varicent ICM, join two or more data sources together by rows to create one source.
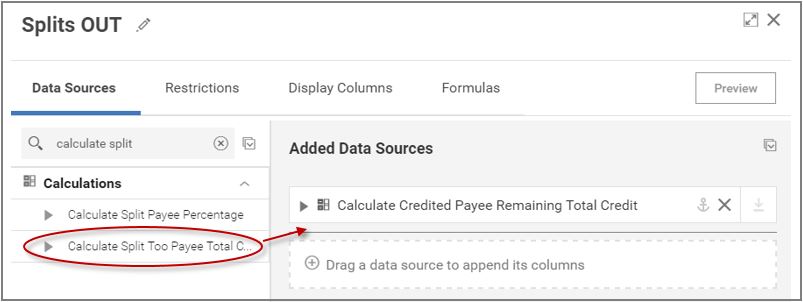
On the Data Sources tab, drag the first source and place it in the Added Data Sources pane.
Drag the second source and place it over the source in the Added Data Sources pane.
Make sure all the columns are mapped.
Tip
Click Automatch to have the application map identical column names automatically.
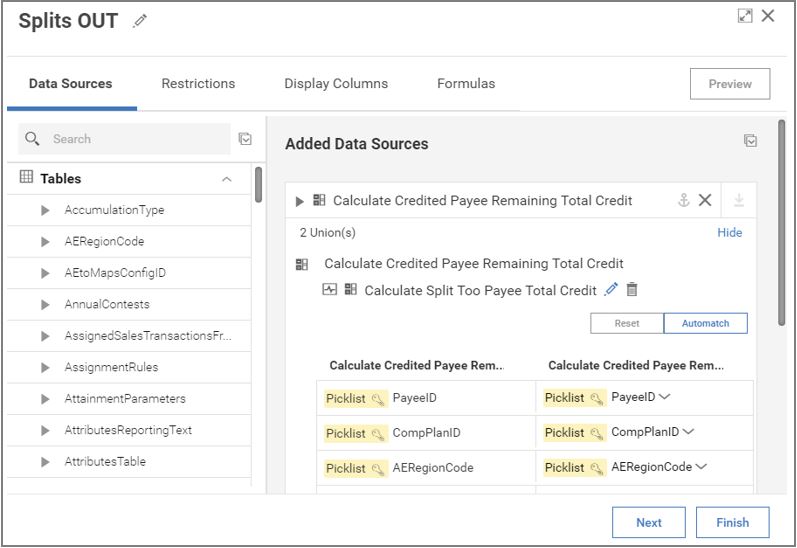
Click the Edit icon next to the second source to view the column mapping section.