Presenter Adaptive enhancements
You can now build reports with real data from data sources. Learn more: Creating a Presenter Adaptive report.
 |
We've also improved the overall report-building experience with these added enhancements:
Auto-aggregation on some visualizations and on numeric columns in tables.
A color picker that saves recently-used colors.
Pick lists now behave more like pick lists in Presenter Structured.
For charts and visualizations, column selection is now saved even when you change the chart type and you can now customize value labels on charts. We've also added a new chart type of KPI visualization.
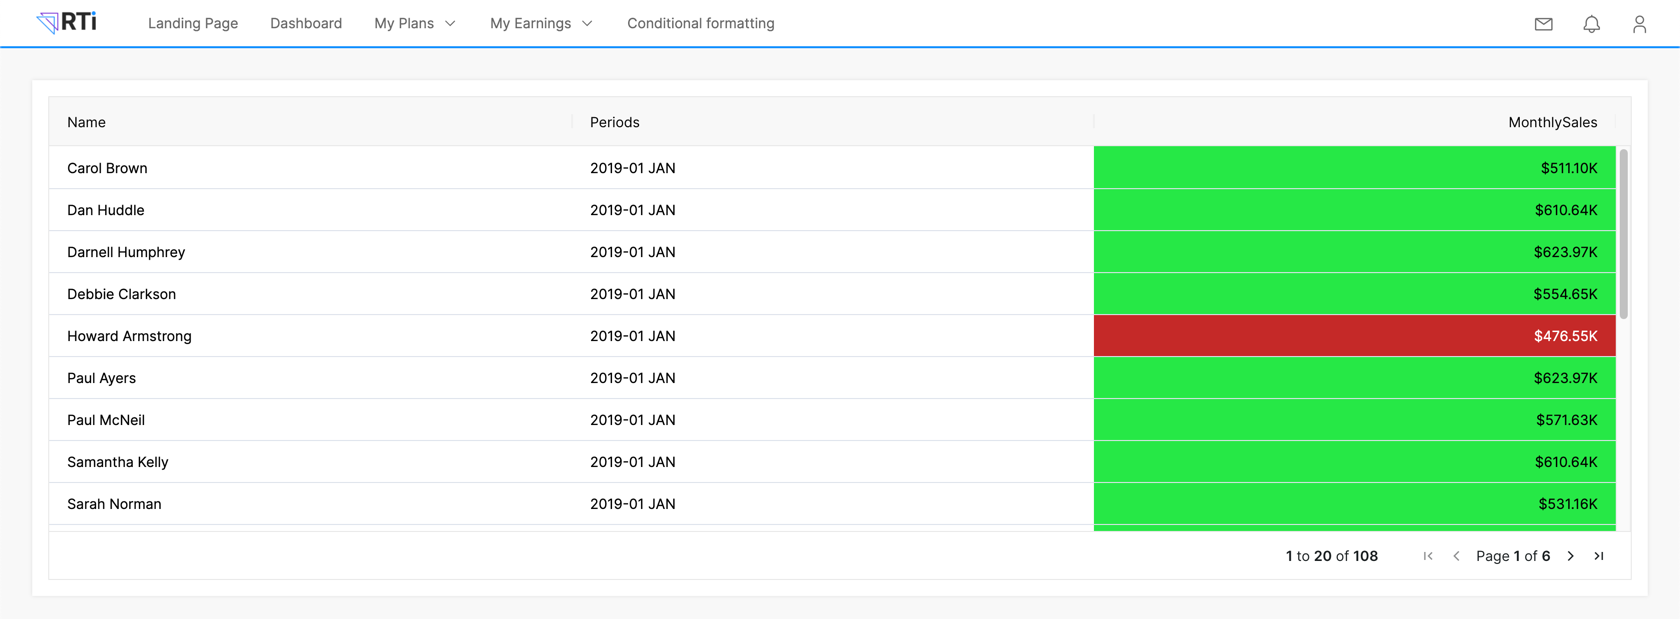
For data tables, you can now set conditional formatting and define column widths so your tables display exactly as you want them to. Learn more: Adding conditional formatting to a Presenter Adaptive table.
 |